So you may have heard Britain has gone TWO WHOLE MONTHS without using coal to generate electricity. Wonderful, Britain I am proud of you. In fact the month of May was the 1st entire calendar month to have no coal burned for electricity since, wait for it, the industrial revolution. So we’ve been doing coal for a while but now thanks to an extra sunny May, a solar energy boom, means no more coal! For now. There are still three coal plants in Britain but these are planned to close in the next five years.
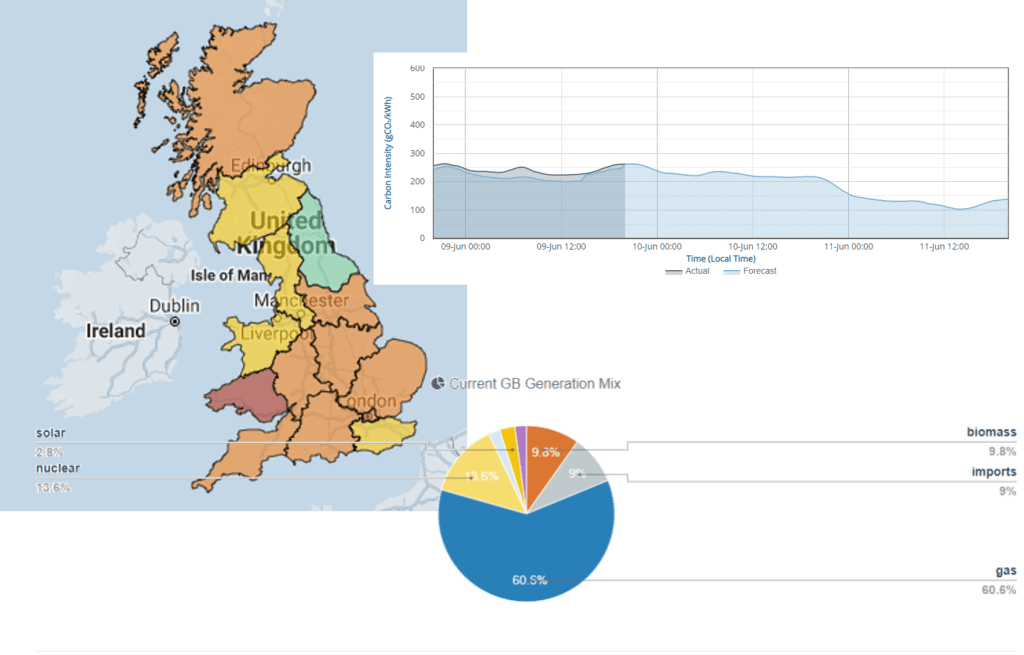
But I hear, what has any of this got to do with Steve and his carbon. Well this is where it gets interesting. I was digging around looking at how we can spot how much energy has been generated from where. I found the Department of Energy and Climate Change Excel sheets interesting for long term trends. Then I found the National Grid ESO’s Great Britains Electricity Explained get yourself a tasty visual monthly snapshot of whats going on with POWER. But finally bring in Steve to present the Two-Day Carbon intensity forecast. Yes there is such a thing as a Carbon Intensity forecast and it will tell you how much carbon is produced per unit of electricity(kWh) in each region. It will tell you how much power is coming from where, is it wind, solar, gas, etc. And with the help of WWF it will tell you when to plug in and when to plug out to make your energy use as renewable as possible.
But that’s it really. If you want to stop reading now I have no new juicy news or it’s quite possible none of this was news for you anyway so umm gutted. However, if you want a bit more let’s break down the carbon intenstity forecast a little more.
What is it?
It’s a carbon intensity forecast. Yes, but did I know carbon intensity is the amount of CO2 produced in grams per kilowatthour of energy produced. Maybe because I kind of said that already. But let’s break it down even more. What’s a kilowatthour look like, a kilowatt hour is an amount of power, specifically electric power. It is equal to using 1000 watts(1kW) of power for 1 hour. This is what you’ll see on your energy bills. Still doesn’t really tell us what it looks like so what uses 1000 watts for an hour in your house. Let’s go with an iron, approx 1kW power, so if you iron clothes for 1 hour you’ve used 1kWh of energy. So that means according to the forecast for right now you’ve produced 262g of CO2. Just because if you waited just 2 days, until June 11th at 2pm that same amount of ironing would only produce 102g. A whopping 160g of carbon saved boom you are a hero and your clothes are looking fresh. That is equivalent to about a km in your average British car. Maybe not much but I think the principle is cool.
And lets take the principle forward a little. Combine it with something else cool like electric cars. Say your electric car takes 8.5 hours to charge from your standard home wall socket. This could maybe be putting out a power at 3400W? so 3.4kW for 8.5 hours is 28.9kWh so if we magically collapsed and folded and did wizardy with time to make that 8.5 hours happen now we would emit 7572g of carbon if we did it on the 11th at 2pm bang on you would emit 2947g. Saving almost 5000g of carbon being emitted. Tada you’re even more of a hero. And not travelled 39km in your average nowadays car. That I reckon is a difference.
But it’s not all down to us, and I’m not recommending a constant consulation of the carbon forecast as to when to have a cup of tea. But if you’re using power heavy appliances for a sustained time. Why not consult the forecast?
